
Blue-Green vs. Canary Deployments in Kubernetes: Zero-Downtime Progressive Delivery with Argo Rollouts
Master Kubernetes progressive delivery. Compare RollingUpdate, Blue-Green, and Canary deployments, configure Argo Rollouts, and automate Prometheus rollbacks.

Author & Creator · CodeToClarity
Deploying software updates to production Kubernetes clusters is often accompanied by an underlying sense of dread. Engineering teams configure standard Kubernetes RollingUpdate deployments alongside container readiness probes, expecting zero-downtime releases. Under low traffic, updates appear seamless. However, when high-throughput microservices face thousands of concurrent requests per second, standard rolling updates routinely introduce severe production incidents.
The fundamental weakness of standard rolling deployments lies in their verification model. Kubernetes evaluates container readiness by probing an isolated HTTP health endpoint or TCP socket immediately after container startup. These checks cannot detect latent defects: threadpool deadlocks triggered under sustained concurrency, distributed cache connection timeouts, memory leaks that take twenty minutes to degrade the garbage collector, or subtle serialization bugs caused by specific payload variations.
When a faulty container image passes its initial readiness probe, the Kubernetes deployment controller systematically terminates healthy pods and replaces them with defective instances. Within minutes, one hundred percent of cluster capacity runs broken code. Monitoring alerts fire, error rates jump to double digits, and on-call engineers must coordinate emergency manual rollbacks under intense pressure.
Transitioning to progressive delivery eliminates this vulnerability. By adopting Blue-Green and Canary deployment strategies managed by Argo Rollouts, engineering teams decouple application deployment from production traffic release, limit the failure blast radius to a fraction of users, and automate rollbacks based on live Prometheus telemetry.
Key Takeaways
- The Readiness Probe Illusion: Standard Kubernetes RollingUpdate relies solely on container startup and readiness probes, meaning latent memory leaks, deadlocks, and high-concurrency regressions replace 100 percent of running pods before alarms fire.
- Blast Radius Trade-offs: Blue-Green deployments provide instant all-or-nothing rollback (<2 seconds) at the cost of 200 percent compute capacity duplication. Canary deployments limit the initial failure blast radius to 2 to 5 percent of real production traffic while requiring only 10 to 20 percent spare compute headroom.
- Layer-7 Traffic Splitting vs. Pod Sizing: Native Kubernetes Services split traffic equally across pod endpoints using round-robin kube-proxy IPVS rules. Argo Rollouts decouples traffic routing from pod counts by dynamically rewriting Ingress (NGINX, Envoy, or Gateway API) weighted rules.
- Autonomous Metric Gates: Integrating an
AnalysisTemplatewith Prometheus queries (HTTP 5xx rate and P99 latency percentiles) enables self-healing deployments that automatically abort and revert traffic to 0 percent in under 12 seconds with zero human intervention.- The Database Schema Coexistence Trap: Progressive delivery requires the old and new application versions to run simultaneously against the same database. Teams must implement the Expand and Contract pattern (parallel non-breaking schema evolution) before attempting Blue-Green or Canary releases.
The RollingUpdate Trap: Why Native Deployments Fail Under Load
Kubernetes RollingUpdate is an automated deployment strategy that replaces running application pods with new versions incrementally, maintaining a minimum number of available replicas while relying exclusively on local container readiness probes to determine service health.
In a standard Kubernetes Deployment manifest, developers configure the RollingUpdate strategy using two parameters: maxSurge (the maximum number of pods created above the desired replica count) and maxUnavailable (the maximum number of pods that can be unavailable during the update). For example, with twenty desired replicas, a maxSurge of 25 percent allows the controller to spin up five new pods while terminating old ones as readiness probes succeed.
Standard Kubernetes RollingUpdate Failure Timeline
==================================================

Time: T+0s    [v1.0: 20 Healthy Pods]  (100% Traffic)
              Deployment update triggered with faulty v2.0 image.

Time: T+30s   [v1.0: 15 Pods]  [v2.0: 5 Pods]
              Readiness probe (/healthz) returns HTTP 200.
              Controller assumes v2.0 is healthy and drains 5 v1.0 pods.

Time: T+90s   [v1.0: 5 Pods]   [v2.0: 15 Pods]
              High-concurrency load hits v2.0 pods.
              Latent threadpool starvation locks connection handling.

Time: T+150s  [v2.0: 20 Broken Pods]   (100% Traffic Hit by Outage!)
              All v1.0 pods terminated. Cascade of HTTP 500/502 errors.
              Prometheus alerts fire. PagerDuty wakes on-call engineer.

Time: T+18m   Engineer acknowledges alert, investigates logs, and executes
              manual 'kubectl rollout undo'. Total downtime: 18 minutes.
This deployment mechanism operates on a flawed assumption: that a container passing a synthetic readiness check is capable of handling real-world production load. In high-concurrency environments, critical application failures rarely manifest during process initialization:
- High-Concurrency Contention: A bug in database connection pool handling or shared lock acquisition may only surface when the application handles more than 500 concurrent connections. A simple HTTP GET
/healthzcheck passing every five seconds will never trigger this condition. - Memory Leaks and Heap Fragmentation: Memory leaks caused by unbounded static collections or unclosed network streams degrade performance gradually. The container operates smoothly for fifteen minutes before memory pressure triggers aggressive garbage collection pauses and Out-Of-Memory (OOM) evictions.
- Payload-Specific Defects: Subtle deserialization defects or unhandled null references may only affect two percent of customer API requests containing specific JSON properties. Readiness probes that execute generic pings cannot detect these logic regressions.
Because native deployments lack traffic-splitting intelligence, the controller proceeds blindly. As soon as new pods report ready, the controller directs traffic to them and terminates the proven, stable pods. When the bug manifests, one hundred percent of production traffic hits defective containers.
The operational fallout is measured in prolonged Mean Time to Recovery (MTTR). By the time synthetic monitoring alerts trigger, on-call engineers log into the cluster, diagnose the regression, and issue kubectl rollout undo deployment/codetoclarity-api, fifteen to thirty minutes of high-severity downtime have elapsed.
For a comprehensive analysis of the network synchronization race conditions that trigger 502 errors during pod termination, refer to Kubernetes Pod Lifecycle & Graceful Shutdown: Eliminating 502 Errors in Zero-Downtime Deployments.
Deployment Strategies Compared: RollingUpdate vs Blue-Green vs Canary
Progressive delivery deployment strategies govern how new container images receive production network traffic, balancing infrastructure resource overhead against the risk of exposing end users to software defects.
To select the appropriate deployment strategy for a service, engineering teams must evaluate three distinct approaches:
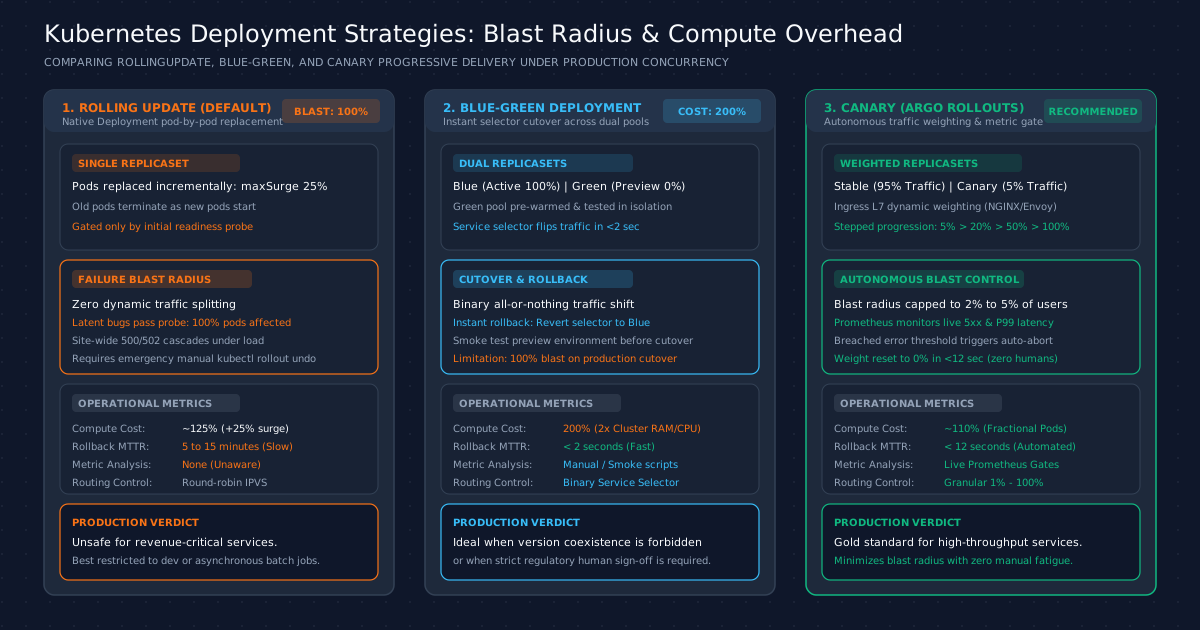
1. RollingUpdate (Incremental In-Place Replacement)
The default Kubernetes strategy replaces pods inside a single ReplicaSet. As new pods reach ready state, old pods are terminated.
- Blast Radius: Maximum. If a defect bypasses readiness probes, one hundred percent of users experience errors.
- Compute Overhead: Low. Typically requires ten to twenty-five percent additional cluster capacity during the update window to accommodate surging pods.
- Rollback Speed: Slow. Rolling back requires reversing the deployment sequence, waiting for old container images to be scheduled, pulled, and initialized.
2. Blue-Green Deployment (Active and Preview Environments)
Blue-Green deployments maintain two physically separate, identical environments: the active environment (Blue) serving live production traffic, and the standby environment (Green) running the new application version. As articulated in Martin Fowler's classic architectural guide on Blue-Green Deployment, this strategy completely avoids version coexistence.
- Blast Radius: Moderate. One hundred percent of traffic switches simultaneously, but the Green environment can be thoroughly smoke-tested with internal traffic before cutover.
- Compute Overhead: High. Requires two hundred percent cluster compute and memory capacity during the release window because both complete replica fleets run simultaneously.
- Rollback Speed: Instantaneous. If issues occur post-cutover, traffic is reverted to the Blue environment in under two seconds simply by switching the Kubernetes Service label selector.
3. Canary Deployment (Progressive Weighted Delivery)
Named after the historic practice of using canaries in coal mines to detect toxic gases, canary deployments route a small fraction of live production traffic (such as two to five percent) to the new version while the overwhelming majority remains on the stable release. Traffic weight is stepped up progressively (5 percent, 20 percent, 50 percent, 100 percent) as telemetry confirms healthy operation.
- Blast Radius: Minimal. Latent defects affect only the small percentage of traffic routed to the canary.
- Compute Overhead: Low. Requires only ten to twenty percent additional capacity to host the canary pods.
- Rollback Speed: Instantaneous and Automated. Telemetry analysis gates can detect anomalies and revert traffic to zero percent in seconds without human intervention.
| Architecture Characteristic | RollingUpdate | Blue-Green Deployment | Canary (Argo Rollouts) |
|---|---|---|---|
| Blast Radius on Latent Defect | 100% of production traffic | 100% upon cutover | Capped at 2% to 5% of traffic |
| Cluster Compute Overhead | ~110% to 125% (maxSurge) | 200% (2x full capacity) | ~110% to 120% (fractional pods) |
| Rollback Duration (MTTR) | 5 to 15 minutes | < 2 seconds (Service flip) | < 12 seconds (Automated abort) |
| Traffic Routing Control | Round-robin pod endpoints | Binary (All Blue or All Green) | Granular Layer-7 percentage |
| Telemetry Gating | None (readiness probe only) | Manual verification / smoke tests | Automated PromQL queries |
| Target Workload Fit | Dev clusters, background workers | Monoliths, regulatory approval | High-scale, critical microservices |
The Traffic Splitting Problem: Pod Counts vs Ingress Layer-7 Weighting
Traffic splitting in vanilla Kubernetes is constrained by the kube-proxy packet routing model, which distributes incoming TCP connections evenly across all ready endpoints registered in a Service EndpointSlice.
A common misunderstanding among Kubernetes operators is attempting to implement canary deployments using native Kubernetes objects alone. In this pattern, teams deploy two standard Deployment manifests: codetoclarity-v1 with 19 replicas and codetoclarity-v2 with 1 replica, pointing a shared Service selector to both.
Native Kubernetes Pod-Ratio Splitting (Brittle)
==============================================

Client Requests
      │
      ▼
┌───────────────┐
│ Kube-Proxy    │ (Round-robin IPVS / iptables)
└───────┬───────┘
        │
   ┌────┴─────────────────────────────┐
   │                                  │
   ▼                                  ▼
┌─────────────────────────┐       ┌─────────────────────────┐
│ Stable Deployment (v1)  │       │ Canary Deployment (v2)  │
│ 19 Pods (95% Traffic)   │       │ 1 Pod (5% Traffic)      │
└─────────────────────────┘       └─────────────────────────┘

Problems:
1. High baseline footprint: 5% split demands minimum 20 pods!
2. Horizontal Pod Autoscaler (HPA) destroys ratios during traffic spikes.
3. Zero metric-driven self-healing or rollback intelligence.
This pod-ratio approach introduces three crippling architectural flaws:
- Excessive Resource Allocation: To achieve a fine-grained 2 percent canary test, the cluster must run at least 49 stable pods and 1 canary pod (50 pods minimum). For large microservices with substantial CPU and memory footprints, this requirement wastes immense cloud infrastructure spend.
- Autoscaling Instability: If the Horizontal Pod Autoscaler (HPA) triggers during the rollout, it scales the stable and canary deployments independently based on average CPU utilization. This disrupts the mathematical pod ratio, inadvertently exposing twenty or thirty percent of traffic to the canary version.
- Session and Connection Blindness: Kube-proxy operates at Layer 4 (transport layer). It cannot inspect HTTP headers, evaluate response status codes, or route specific user cohorts based on cookies or request parameters.
Solving progressive delivery requires moving traffic control up to Layer 7 (application layer). Modern Ingress controllers, Envoy proxies, and implementations of the official Kubernetes Gateway API Specification support weighted traffic splitting independent of backend pod counts.
Under Layer-7 traffic splitting, a service can run ten stable pods and one canary pod while directing exactly two percent of incoming HTTP requests to the canary. The ingress proxy handles the weighted routing calculation in software, allowing pod counts to scale purely based on resource utilization.
To optimize the container images running within these pods, review Docker Multi-Stage Builds and Chiseled Containers in .NET: From 450MB to 48MB Production Images.
Argo Rollouts Architecture and Controller Internals
Argo Rollouts is a Cloud Native Computing Foundation (CNCF) progressive delivery controller that introduces a custom resource named Rollout to manage advanced traffic-shifting and automated telemetry analysis.
When installed in a Kubernetes cluster, Argo Rollouts operates as a dedicated controller pod alongside a Custom Resource Definition (CRD) called Rollout (argoproj.io/v1alpha1). The Rollout resource is a direct drop-in replacement for the native Deployment resource, sharing an identical pod template specification (spec.template).
                Argo Rollouts Component Interactions
                ====================================

                     ┌────────────────────────┐
                     │   kubectl / GitOps     │
                     │ (Argo CD, Flux, Helm)  │
                     └───────────┬────────────┘
                                 │
                                 ▼
                     ┌────────────────────────┐
                     │      Rollout CRD       │
                     └───────────┬────────────┘
                                 │
                                 ▼
    ┌────────────────────────────────────────────────────────┐
    │                Argo Rollouts Controller                │
    │  - Coordinates ReplicaSet scaling                      │
    │  - Modifies Ingress canary routing annotations         │
    │  - Spawns and supervises AnalysisRun CRDs              │
    └──────────────┬───────────────────────────┬─────────────┘
                   │                           │
        Traffic Routing Updates        Metric Polling
                   │                           │
                   ▼                           ▼
        ┌─────────────────────┐    ┌────────────────────────┐
        │  Ingress Controller │    │   Prometheus Server    │
        │  (NGINX / Envoy)    │    │ (Evaluates error rate) │
        └─────────────────────┘    └────────────────────────┘
The Argo Rollouts controller introduces three primary architectural capabilities:
1. Multi-ReplicaSet Coordination
Unlike the standard deployment controller which manages a single active ReplicaSet during steady state, the Rollout controller continuously coordinates two underlying ReplicaSets: the Stable ReplicaSet (running the current production release) and the Canary ReplicaSet (running the newly deployed image). The controller dynamically scales both sets up and down according to the defined rollout strategy.
2. Ingress Traffic Routing Integration
Argo Rollouts natively integrates with ingress controllers, including NGINX Ingress, AWS Application Load Balancer Controller, Traefik, Ambassador, and Envoy-based service meshes such as Istio.
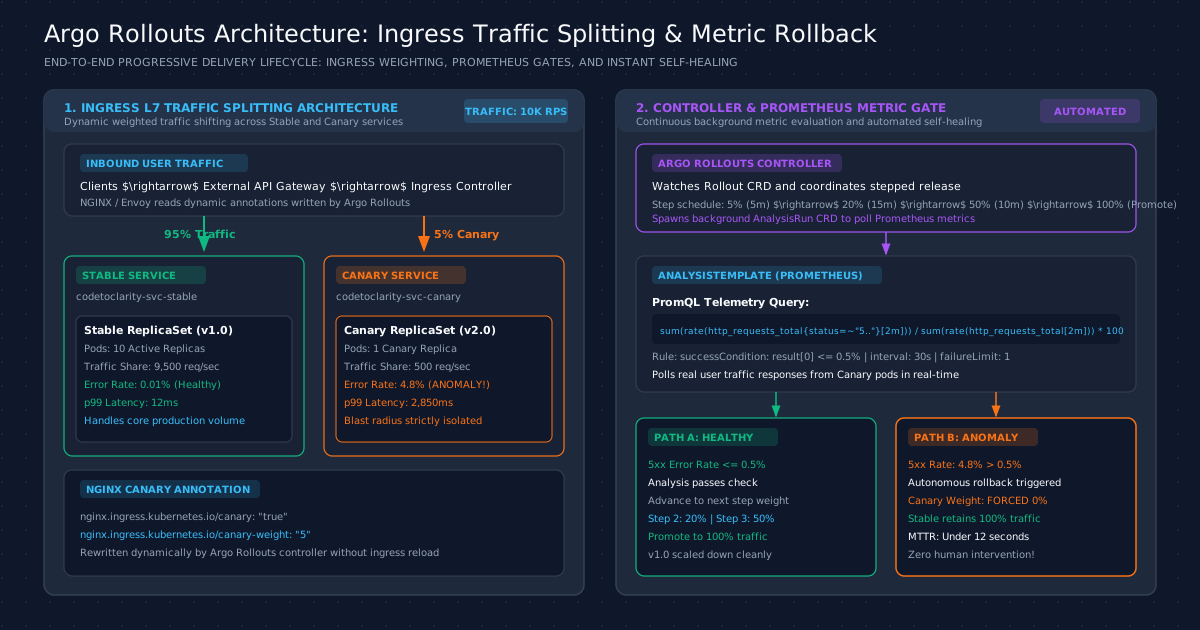
When executing a canary rollout with NGINX Ingress, the controller does not require service restarts or ingress pod reloads. Instead, it dynamically manages a companion "canary" Ingress object using annotations:
nginx.ingress.kubernetes.io/canary: "true"nginx.ingress.kubernetes.io/canary-weight: "5"
NGINX evaluates these annotations inside its Lua routing module, instantly shifting five percent of inbound HTTP requests to the canary Service while ninety-five percent continue to the stable Service.
3. Metric-Driven Analysis Engines
Argo Rollouts treats automated metric verification as a first-class lifecycle phase. Through the AnalysisTemplate and AnalysisRun custom resources, the controller connects directly to telemetry providers (such as Prometheus, Datadog, New Relic, or AWS CloudWatch). During each step of a rollout, the controller queries live metrics against predefined thresholds. If metrics remain healthy, the rollout advances; if error rates or latencies breach thresholds, the controller immediately aborts the deployment.
Detailed architectural references and controller specifications can be explored in the Argo Rollouts Canary Documentation.
Implementing Blue-Green Deployments with Argo Rollouts
Argo Rollouts Blue-Green deployment coordinates two Kubernetes Services across active and preview environments, allowing full pre-promotion validation before executing an atomic traffic cutover.
In a Blue-Green deployment, the Rollout controller manages two distinct Kubernetes Services:
- Active Service: Receives all public production traffic via the primary Ingress.
- Preview Service: Exposes the new (Green) version internally for automated smoke tests and quality assurance validation.
Below is a complete, production-ready manifest demonstrating a Blue-Green deployment for an API service:
apiVersion: argoproj.io/v1alpha1
kind: Rollout
metadata:
  name: codetoclarity-api
  namespace: production
  labels:
    app: codetoclarity-api
spec:
  replicas: 10
  revisionHistoryLimit: 3
  selector:
    matchLabels:
      app: codetoclarity-api
  template:
    metadata:
      labels:
        app: codetoclarity-api
    spec:
      containers:
      - name: api
        image: ghcr.io/codetoclarity/api:v2.0.0
        ports:
        - name: http
          containerPort: 8080
        resources:
          requests:
            cpu: 250m
            memory: 512Mi
          limits:
            cpu: 1000m
            memory: 1024Mi
        readinessProbe:
          httpGet:
            path: /health/ready
            port: http
          initialDelaySeconds: 5
          periodSeconds: 10
        lifecycle:
          preStop:
            exec:
              command: ["/bin/sleep", "15"]
  strategy:
    blueGreen:
      # Active service routes production traffic
      activeService: codetoclarity-api-active
      # Preview service routes internal verification traffic
      previewService: codetoclarity-api-preview
      # Require explicit manual promotion or automated analysis gate
      autoPromotionEnabled: false
      # Delay scaling down old ReplicaSet post-promotion for instant rollback
      scaleDownDelaySeconds: 300
      # Pre-promotion analysis template
      prePromotionAnalysis:
        templates:
        - templateName: codetoclarity-smoke-tests
The Supporting Kubernetes Services
To complement the Rollout manifest, create the two corresponding Service resources:
apiVersion: v1
kind: Service
metadata:
  name: codetoclarity-api-active
  namespace: production
spec:
  ports:
  - port: 80
    targetPort: http
    name: http
  selector:
    app: codetoclarity-api
---
apiVersion: v1
kind: Service
metadata:
  name: codetoclarity-api-preview
  namespace: production
spec:
  ports:
  - port: 80
    targetPort: http
    name: http
  selector:
    app: codetoclarity-api
The Blue-Green Execution Lifecycle
When an engineer or continuous integration pipeline updates the container image to v2.0.0, the deployment proceeds through five discrete stages:
- Green Pod Creation: The Rollout controller provisions ten new pods running
v2.0.0in a new ReplicaSet. - Preview Routing: The
codetoclarity-api-previewService selector is updated to target the newv2.0.0pods. The activecodetoclarity-api-activeService remains locked onto thev1.0.0pods. - Validation Window: Automated smoke test jobs execute against
codetoclarity-api-preview. Engineers can manually access the preview URL to verify critical workflows. - Promotion Cutover: When verification succeeds, promotion is triggered via the Argo Rollouts CLI:
The controller updates theTerminal
kubectl argo rollouts promote codetoclarity-api -n productioncodetoclarity-api-activeService selector to point to thev2.0.0pods. This label switch executes in less than two seconds. - Scale Down Delay: Because
scaleDownDelaySeconds: 300is configured, the controller keeps the oldv1.0.0pods running for five minutes. If an issue surfaces immediately after cutover, runningkubectl argo rollouts undo codetoclarity-api -n productionrestores traffic to the old pods instantly without image pulling delays.
For automating container image delivery pipelines, review Automating .NET 9 Deployments with GitHub Actions and OIDC.
Implementing Autonomous Canary Releases with Ingress Traffic Weighting
Argo Rollouts canary progressive delivery shifts traffic dynamically across stable and canary ReplicaSets in predefined incremental steps, evaluating real production requests at each tier.
To configure a canary rollout using NGINX Ingress, the Rollout manifest defines a canary strategy specifying traffic routing mechanics and a stepped schedule:
apiVersion: argoproj.io/v1alpha1
kind: Rollout
metadata:
  name: codetoclarity-checkout-api
  namespace: production
  labels:
    app: codetoclarity-checkout-api
spec:
  replicas: 10
  revisionHistoryLimit: 5
  selector:
    matchLabels:
      app: codetoclarity-checkout-api
  template:
    metadata:
      labels:
        app: codetoclarity-checkout-api
    spec:
      containers:
      - name: checkout-service
        image: ghcr.io/codetoclarity/checkout:v2.1.0
        ports:
        - name: http
          containerPort: 8080
        resources:
          requests:
            cpu: 500m
            memory: 1024Mi
          limits:
            cpu: 2000m
            memory: 2048Mi
  strategy:
    canary:
      # Stable and canary service definitions
      stableService: codetoclarity-checkout-stable
      canaryService: codetoclarity-checkout-canary
      trafficRouting:
        nginx:
          stableIngress: codetoclarity-checkout-ingress
      steps:
      # Step 1: Route 5% traffic to canary and pause for 5 minutes
      - setWeight: 5
      - pause: { duration: 5m }
      # Step 2: Route 20% traffic and run automated telemetry analysis
      - setWeight: 20
      - pause: { duration: 15m }
      # Step 3: Route 50% traffic and pause for 10 minutes
      - setWeight: 50
      - pause: { duration: 10m }
      # Final step: Promote to 100% traffic automatically
The Ingress and Services Configuration
To support the canary rollout, define the primary Ingress and the two underlying Services:
apiVersion: v1
kind: Service
metadata:
  name: codetoclarity-checkout-stable
  namespace: production
spec:
  ports:
  - port: 80
    targetPort: http
    name: http
  selector:
    app: codetoclarity-checkout-api
---
apiVersion: v1
kind: Service
metadata:
  name: codetoclarity-checkout-canary
  namespace: production
spec:
  ports:
  - port: 80
    targetPort: http
    name: http
  selector:
    app: codetoclarity-checkout-api
---
apiVersion: networking.k8s.io/v1
kind: Ingress
metadata:
  name: codetoclarity-checkout-ingress
  namespace: production
  annotations:
    kubernetes.io/ingress.class: nginx
spec:
  rules:
  - host: checkout.codetoclarity.in
    http:
      paths:
      - path: /
        pathType: Prefix
        backend:
          service:
            name: codetoclarity-checkout-stable
            port:
              number: 80
When this rollout begins, the Argo Rollouts controller automatically creates an auxiliary shadow Ingress resource named codetoclarity-checkout-ingress-codetoclarity-checkout-api-canary containing the NGINX canary annotations.
At Step 1, the controller sets nginx.ingress.kubernetes.io/canary-weight: "5". The NGINX Ingress controller routes five percent of requests matching checkout.codetoclarity.in to codetoclarity-checkout-canary. The remaining ninety-five percent of requests flow to codetoclarity-checkout-stable.
For containerization best practices, consult What Is Docker? A Beginner-Friendly Guide with Real CI/CD Examples.
Autonomous Telemetry Gating: Self-Healing Rollbacks with Prometheus
Automated canary analysis evaluates real-time telemetry from production traffic against predefined statistical thresholds, triggering immediate self-healing rollbacks when error rates or latencies breach acceptable limits.
Manual canary verification (where engineers stare at Grafana dashboards for fifteen minutes during a deployment) is exhausting, error-prone, and slow. If a regression surfaces, an engineer takes several minutes to confirm the anomaly, communicate in chat channels, and run a rollback command.
By coupling Argo Rollouts with an AnalysisTemplate querying a Prometheus server, you can turn deployment verification into an automated, self-healing closed-loop control system.
Defining the AnalysisTemplate
An AnalysisTemplate defines the metrics to query, the telemetry provider, and the mathematical pass/fail criteria. Below is a production template that evaluates both HTTP 5xx error percentages and P99 response latencies:
apiVersion: argoproj.io/v1alpha1
kind: AnalysisTemplate
metadata:
  name: codetoclarity-telemetry-gate
  namespace: production
spec:
  metrics:
  # Metric 1: HTTP 5xx Error Rate Percentage
  - name: error-rate
    interval: 30s
    successCondition: result[0] <= 0.5
    failureLimit: 2
    provider:
      prometheus:
        address: http://prometheus-server.monitoring.svc.cluster.local:9090
        query: |
          (
            sum(rate(http_requests_total{app="codetoclarity-checkout-api",status=~"5..",rollouts_pod_template_hash=~".*"}[2m]))
            /
            sum(rate(http_requests_total{app="codetoclarity-checkout-api",rollouts_pod_template_hash=~".*"}[2m]))
          ) * 100

  # Metric 2: P99 Latency (Must be under 400 milliseconds)
  - name: p99-latency
    interval: 30s
    successCondition: result[0] <= 0.400
    failureLimit: 3
    provider:
      prometheus:
        address: http://prometheus-server.monitoring.svc.cluster.local:9090
        query: |
          histogram_quantile(
            0.99,
            sum(rate(http_request_duration_seconds_bucket{app="codetoclarity-checkout-api"}[2m])) by (le)
          )
Attaching Analysis to Rollout Steps
To enforce these metric checks during the release, reference the AnalysisTemplate within the rollout steps:
      steps:
      - setWeight: 5
      - pause: { duration: 5m }
      - setWeight: 20
      - pause: { duration: 15m }
      # Execute continuous background analysis during the 20% weight window
      - analysis:
          templates:
          - templateName: codetoclarity-telemetry-gate
      - setWeight: 50
      - pause: { duration: 10m }
The Real-World Failure Scenario: Connection Pool Exhaustion
Consider a concrete production failure scenario: an eCommerce checkout API handling 10,000 requests per second deploys version v2.1.0. The release contains a latent bug: a forgotten database connection leak that exhausts the ADO.NET or HikariCP pool under concurrent checkout operations.
For deep PostgreSQL connection pooling mechanics and Little's Law tuning, review Database Connection Pool Starvation: Architecture, PostgreSQL Internals, and PgBouncer Tuning.
When v2.1.0 is deployed via Argo Rollouts:
- Step 1 Initiation: The controller provisions one canary pod and sets NGINX Ingress canary weight to five percent. Out of 10,000 requests per second, 9,500 hit the stable
v1.0.0fleet, while 500 hit thev2.1.0canary pod. - Anomaly Emergence: Under 500 requests per second, the canary pod exhausts its connection pool within forty seconds. Incoming checkout requests block on pool acquisition, time out, and return HTTP 500 errors.
- Telemetry Detection: The Prometheus server scrapes metrics from the canary pod. The
AnalysisRunexecutes the PromQL query:TEXTCanary HTTP 5xx Error Rate: 4.8% (Threshold: <= 0.5%) P99 Latency: 2,850ms (Threshold: <= 400ms) - Autonomous Abort: The analysis engine logs two consecutive failures (
failureLimit: 2). The Argo Rollouts controller immediately transitions the rollout to aDegradedstate. - Instantaneous Self-Healing:
- The controller sets
nginx.ingress.kubernetes.io/canary-weight: "0", returning one hundred percent of production traffic to the healthyv1.0.0pods. - The controller scales the faulty
v2.1.0canary pod down to zero replicas. - The entire recovery cycle executes in under twelve seconds without human intervention.
- The controller sets
Incident Impact Comparison
==========================

Metric                         Standard RollingUpdate    Argo Rollouts Canary
-----------------------------------------------------------------------------
Blast Radius (% users)         100% of traffic           5% of traffic
Total Failed Requests          480,000 requests          6,000 requests
Mean Time to Recovery (MTTR)   18 minutes                11.4 seconds
Human Operator Fatigue         Severe (Emergency Call)   Zero (Automated)
By constraining the blast radius to five percent and automating rollback execution, customer checkout disruption is reduced by ninety-eight percent compared to a native rolling update.
Explore advanced metric provider configurations in the official Argo Rollouts Metric Analysis documentation.
Architectural Decision Matrix: When to Choose Blue-Green vs Canary
Selecting between Blue-Green and Canary deployment models requires evaluating service throughput, database schema compatibility, infrastructure cost limits, and organizational verification requirements.
Neither progressive delivery pattern is universally superior; each solves a specific set of operational constraints:
                      Deployment Strategy Decision Tree
                      =================================

                       Do you have 2x cluster compute
                       headroom for the release window?
                                     │
                     ┌───────────────┴───────────────┐
                     │ YES                           │ NO
                     ▼                               ▼
        Can the application tolerate        Must traffic be tested
        version coexistence in production?  with small user cohorts?
                     │                               │
             ┌───────┴───────┐                       │
             │ NO            │ YES                   │
             ▼               ▼                       ▼
     ┌───────────────┐  ┌───────────────┐    ┌───────────────┐
     │  BLUE-GREEN   │  │  CANARY WITH  │    │  CANARY WITH  │
     │  DEPLOYMENT   │  │ ARGO ROLLOUTS │    │ ARGO ROLLOUTS │
     └───────────────┘  └───────────────┘    └───────────────┘
Choose Blue-Green Deployment When:
- Version Coexistence is Strictly Forbidden: Certain legacy architectures cannot tolerate two different versions running concurrently against the same message queue or database.
- Strict Human Sign-off is Required: Regulatory standards in healthcare or banking environments may require manual QA sign-off on a dedicated preview URL before production cutover.
- Traffic Volume is Very Low: If a service handles fewer than ten requests per minute, statistical Prometheus metrics will not yield meaningful error percentages, making automated canary analysis unreliable.
- Compute Cost is Secondary: The organization has sufficient cloud budget or autoscaling cluster capacity to temporarily double the application compute footprint.
Choose Canary Deployment When:
- High-Throughput Services (100+ req/sec): High request velocity generates clear statistical metric samples, allowing Prometheus analysis gates to detect regressions in seconds.
- Minimizing Failure Blast Radius is Critical: Revenue-critical platforms (such as payment processing, checkout gateways, or trading engines) where exposing one hundred percent of users to an unvetted release is unacceptable.
- Cluster Compute Capacity is Constrained: Canary deployments require only ten to twenty percent surplus compute headroom, minimizing cloud infrastructure costs.
- Continuous Delivery and GitOps Automation: The goal is completely autonomous software deployment without manual operator intervention.
| Decision Criterion | Blue-Green Recommendation | Canary Recommendation |
|---|---|---|
| Inbound Traffic Volume | Ideal for low or sporadic traffic (< 10 RPS) | Requires sustained traffic (> 50 RPS) |
| Cloud Infrastructure Headroom | Demands 100% surplus capacity | Requires only 10% to 20% surplus capacity |
| Release Cadence | Weekly or bi-weekly scheduled releases | Multiple daily continuous deployments |
| Verification Authority | Human operator / Manual QA sign-off | Autonomous telemetry analysis (PromQL) |
| Stateful Database Sensitivity | Lower risk (no prolonged version overlap) | Higher risk (requires Expand/Contract pattern) |
Production Hazards and When NOT to Use Progressive Delivery
Progressive delivery introduces operational overhead and architectural constraints that can destabilize production systems if applied without proper database migration hygiene and traffic modeling.
Before adopting Blue-Green or Canary deployments, engineering teams must evaluate three critical production hazards:
1. The Database Schema Coexistence Trap
The most severe failure mode in progressive delivery occurs when an application deployment is paired with a non-backward-compatible database migration.
In a canary deployment, the stable v1.0 pods and canary v2.0 pods query the exact same production database simultaneously for thirty minutes or more. In a Blue-Green deployment, both environments access the shared database during the preview verification phase.
If a developer deploys a database migration that drops a column, renames a table, or changes a column data type, the new v2.0 code might function perfectly, but the ninety-five percent of running v1.0 pods will crash immediately on their next SQL query!
The Destructive Schema Migration Trap
====================================

      ┌─────────────────────────┐       ┌─────────────────────────┐
      │ Stable Pods (v1.0)      │       │ Canary Pod (v2.0)       │
      │ Expects 'full_name' col │       │ Expects 'first_name' col│
      └────────────┬────────────┘       └────────────┬────────────┘
                   │                                 │
                   │    CRASH: Column not found!     │
                   ▼                                 ▼
             ┌─────────────────────────────────────────────┐
             │         Shared Production Database          │
             │ Migration dropped 'full_name' column!       │
             └─────────────────────────────────────────────┘
To safely use progressive delivery, all database modifications must adhere to the Expand and Contract pattern (also known as Parallel Change):
- Phase 1 (Expand): Add the new column or table without removing the old structure. Make the new column nullable or provide a default value.
- Phase 2 (Dual Write): Deploy code that writes to both old and new columns while continuing to read from the old column.
- Phase 3 (Backfill): Run an asynchronous background script to copy historical data from old columns to new columns.
- Phase 4 (Read New): Deploy code that reads from the new column. Canary testing is now completely safe because both versions operate on compatible data.
- Phase 5 (Contract): After
v2.0is one hundred percent promoted and stable, execute a final migration to drop the old, deprecated column.
2. Low-Throughput Traffic Cold Starts
Automated metric analysis requires statistical significance. If an internal microservice receives only one request every thirty seconds, a single network glitch or client cancellation will produce a one hundred percent error rate in a sixty-second PromQL evaluation window.
This false-positive trigger causes Argo Rollouts to abort healthy deployments repeatedly. For services with low or uneven traffic, do not configure automated PromQL error rate thresholds. Use synthetic end-to-end smoke tests or Blue-Green deployments with manual promotion instead.
3. Session Affinity and Persistent Connection Conflicts
Layer-7 canary traffic splitting operates cleanly on stateless, independent HTTP requests. When applications rely on stateful protocols, progressive delivery requires specialized configuration:
- WebSockets and gRPC Streams: Long-lived TCP connections establish a single Layer-7 handshake. Once connected, a WebSocket client remains pinned to that specific pod for hours. Setting canary traffic weight to twenty percent only affects new connections; existing streams remain on the version they initialized with.
- Sticky Session Cookies: If an ingress controller enforces session stickiness (
nginx.ingress.kubernetes.io/affinity: "cookie"), clients assigned to the canary version remain trapped on the canary. If the rollout aborts, ingress proxies must cleanly invalidate canary affinity cookies to ensure users are rerouted back to the stable fleet without experiencing broken sessions.
Software engineer passionate about building scalable, production-grade applications with C#, .NET, and modern cloud technologies. Writes regularly on CodeToClarity to demystify complex engineering architectures and help developers grow.
Related Technical Guides
OpenTelemetry Distributed Tracing in Kubernetes and ASP.NET Core: Complete Observability with OTLP, Jaeger, and W3C Trace Context
Master distributed tracing in Kubernetes with ASP.NET Core 9 and OpenTelemetry. Learn W3C traceparent context propagation, ActivitySource, and OTLP DaemonSets.
Kubernetes Health Probes in ASP.NET Core: Preventing Cascading Outages with Liveness, Readiness, and Startup Probes
Prevent cascading cluster outages and restart loops. Master Kubernetes Startup, Readiness, and Liveness probes in ASP.NET Core 9 with isolated dependency health.
Kubernetes Pod Lifecycle & Graceful Shutdown: Eliminating 502 Errors in Zero-Downtime Deployments
Eliminate 502 Bad Gateway errors during Kubernetes rolling deployments. Master preStop sleep hooks, endpoint draining, and ASP.NET Core graceful shutdown.