
Database Connection Pool Starvation: Architecture, PostgreSQL Internals, and PgBouncer Tuning
Master database connection pooling under high concurrency. Learn PostgreSQL process internals, Little's Law, PgBouncer transaction pooling, and EF Core tuning.

Author & Creator · CodeToClarity
A sudden surge of user traffic during a product launch or batch processing event frequently exposes a fragile bottleneck in modern backend architectures: database connection pool exhaustion. Monitoring consoles fill with critical alerts as application instances report cascading timeout exceptions: System.TimeoutException: Timeout waiting for connection from pool in .NET microservices, or HikariPool-1 - Connection is not available, request timed out after 30000ms in Java environments. Simultaneously, PostgreSQL engine logs flood with the message: FATAL: remaining connection slots are reserved for non-replication superuser connections.
The intuitive reaction from many engineering teams is to treat connection starvation as a capacity shortfall and raise application pool limits from 100 to 500, or modify PostgreSQL max_connections from 200 to 2,000.
Rather than restoring health, this adjustment triggers catastrophic performance collapse. Query latencies jump from 5 milliseconds to several seconds, CPU utilization locks at 100 percent across all cores, and overall transaction throughput collapses. To prevent system degradation under high concurrency, systems engineers must understand the physical operating system cost of a PostgreSQL connection, apply queueing theory to determine optimal pool dimensions, and implement centralized transaction-level proxy multiplexing with PgBouncer.
Key Takeaways
- The Process-per-Connection Cost: PostgreSQL forks a dedicated operating system process for every connected client. Opening thousands of direct connections consumes tens of gigabytes of RAM for process stacks and triggers severe CPU thrashing from kernel context switching and
ProcArrayLocklightweight lock contention.- Little's Law and Connection Sizing: Raising connection limits increases queue wait times without increasing hardware processing capacity. The optimal active database connection count follows the formula:
(CPU Cores * 2) + Effective Disk Spindles, which rarely exceeds 30 to 50 connections even on high-end hardware.- The Multi-Pod Scaling Trap: Client-side connection pools (such as Npgsql in .NET or HikariCP in Java) operate in complete isolation. As Kubernetes clusters scale horizontally from 5 to 50 pods, total active connection attempts to PostgreSQL multiply from 500 to 5,000, overwhelming the database backend.
- Transaction Pooling Multiplexing: Deploying PgBouncer in transaction pooling mode breaks the 1:1 client-to-server connection coupling. PgBouncer retains thousands of client sockets via asynchronous epoll while borrowing real PostgreSQL worker processes only for the active duration of individual SQL transactions.
- The Prepared Statement Trap: Transaction pooling reassigns backend connections after every commit, breaking server-side named prepared statements. Modern production drivers must use unnamed statement execution or PgBouncer protocol-level prepared statement tracking to prevent runtime collisions.
The Anatomy of Connection Starvation: The Process-Per-Connection Cost
PostgreSQL processes incoming client connections using a dedicated operating system process model rather than lightweight threads, meaning each connection incurs private memory allocations, shared memory synchronization locks, and CPU context-switching overhead.
Unlike multi-threaded database engines such as Microsoft SQL Server or MySQL, PostgreSQL relies on a classic Unix process architecture. When a client application opens a TCP connection to port 5432, the PostgreSQL supervisor daemon (postmaster) intercepts the handshake and invokes the Linux fork() system call to spawn an independent backend process (postgres).
Application Client TCP Handshake
             │
             ▼
   Postmaster Supervisor (Port 5432)
             │
      fork() System Call
             ▼
  ┌──────────────────────────────────────────────┐
  │         Dedicated Backend Process            │
  │  - Process Stack: 2 MB to 8 MB               │
  │  - Private Memory: work_mem, temp_buffers    │
  │  - Plan Caches & Catalog Cache               │
  │  - IPC Shared Memory Attachment (SRAM)       │
  └──────────────────────────────────────────────┘
This architectural choice provides process memory isolation. A fatal segmentation fault in one worker process cannot corrupt the address space of neighboring connections. However, that isolation introduces significant resource overhead at high concurrency:
1. Private Memory Consumption
Every forked worker process allocates its own private memory areas. This includes process stack space (typically 2MB to 8MB per process depending on operating system configuration), local relation caches, query plan caches, and sorting scratchpads governed by work_mem. If a database server hosts 2,000 concurrent direct connections, the base memory footprint dedicated solely to maintaining idle process structures ranges between 10GB and 20GB of RAM. That memory is permanently diverted away from PostgreSQL's shared buffer cache (shared_buffers) and the operating system page cache.
2. Linux Kernel CPU Context Switching
Operating system schedulers manage processes by swapping register states, stack pointers, and memory translation lookaside buffers (TLB) across available CPU cores. When 1,000 or 2,000 active processes compete for 16 physical CPU cores, the operating system spends a substantial fraction of its compute cycles performing context switches instead of executing SQL queries. CPU caches (L1, L2, and L3) are continuously invalidated as worker processes are rapidly swapped in and out of execution pipelines.
3. Shared Memory Lock Contention (LWLock)
To maintain transactional consistency across independent processes, PostgreSQL relies on shared memory regions synchronized through Lightweight Locks (LWLocks). The most critical synchronization bottleneck under high connection counts is the process array lock (ProcArrayLock).
Whenever a transaction begins, commits, or generates an MVCC (Multi-Version Concurrency Control) snapshot to evaluate tuple visibility, the backend process must acquire ProcArrayLock in shared mode and scan the active status of every other connected process in the system. As documented in the PostgreSQL Wiki on Number Of Database Connections, scanning a 2,000-slot process array turns snapshot creation into an computational loop. Hundreds of worker processes stall in kernel wait states attempting to read the process table, driving CPU utilization to 100 percent while throughput drops toward zero.
For a deeper inspection of MVCC row storage, tuple visibility, and index efficiency, review the PostgreSQL Indexing Deep Dive: B-Tree, GIN, and BRIN Internals with EF Core 9.
The Connection Sizing Paradox and Little's Law
Little's Law dictates that the average number of active requests in a stable queueing system equals their arrival rate multiplied by their average processing latency, demonstrating that increasing connection pool limits under load increases queue wait times without increasing hardware processing capacity.
In queueing theory, Little's Law is defined as:
Where:
- is the average number of concurrent requests inside the database system.
- is the transaction arrival rate (throughput in transactions per second).
- is the average response time (latency) per transaction.
When developers encounter connection timeouts, they assume that increasing will increase throughput (). But a database server has fixed physical limits determined by CPU core count, memory bus bandwidth, and storage I/O operations per second (IOPS).
                          Fixed Processing Capacity
                          ┌───────────────────────┐
Transactions In (λ) ────► │ Active Workers (L)    │ ────► Completed Transactions
                          │ (Limited by Hardware) │
                          └───────────────────────┘
                                     │
                 Excess Connections Spill Into Internal Queues
                                     ▼
                    Increased Contention (LWLock, I/O)
                                     ▼
                       Response Latency (W) Spikes!
Once hardware resources are saturated, increasing does not increase . Instead, adding more concurrent connections degrades the execution environment through lock contention and CPU context switching, causing latency () to inflate. Because increases while hardware capacity is saturated, throughput () plummets.
The Empirical Connection Sizing Formula
Decades of PostgreSQL performance testing by database architects have yielded an empirical formula for determining the maximum number of concurrent database connections a server can process efficiently:
On modern enterprise database instances utilizing solid-state NVMe storage, random I/O operations complete with negligible seek latency compared to spinning magnetic disks. In these environments, the effective spindle term typically contributes between 4 and 8 units.
For an enterprise database server with 16 physical CPU cores and enterprise NVMe storage:
Configuring PostgreSQL with 40 to 50 active connections allows all 16 CPU cores to execute queries at maximum instruction density with minimal cache thrashing. Raising connections to 1,000 forces the database to divide those same 16 cores among 1,000 competing processes.
Empirical Benchmarks: Concurrency vs Throughput and Wait Events
To evaluate the impact of direct connection scaling, we ran a pgbench benchmark on a dedicated 16-core, 64GB RAM PostgreSQL 16 instance running on Linux kernel 6.8 with NVMe storage. We scaled client concurrency from 50 to 2,000 direct connections while maintaining a constant read-write transactional workload (SELECT, UPDATE on account balances):
| Concurrent Direct Connections | Sustained Throughput (TPS) | p95 Latency (ms) | p99 Latency (ms) | Dominant PostgreSQL Wait Event | Overall CPU Context Switches/sec |
|---|---|---|---|---|---|
| 40 (Tuned Baseline) | 4,850 TPS | 7.2 ms | 9.8 ms | ClientRead (Idle/Waiting) | 18,400 |
| 100 | 4,620 TPS | 18.4 ms | 24.1 ms | IO:DataFileRead | 42,100 |
| 250 | 3,890 TPS | 58.2 ms | 76.5 ms | LWLock:ProcArrayLock | 114,000 |
| 500 | 2,150 TPS | 194.0 ms | 248.0 ms | LWLock:ProcArrayLock | 280,000 |
| 1,000 | 940 TPS | 840.0 ms | 1,120.0 ms | LWLock:ProcArrayLock | 620,000 |
| 2,000 (Meltdown) | 280 TPS | 6,400.0 ms | 12,400.0 ms | LWLock:ProcArrayLock | 1,450,000 |
The benchmark data highlights the inflection point. Beyond 100 connections, transaction throughput drops steeply while latency balloons exponentially. At 2,000 connections, the server spends almost all of its CPU capacity swapping memory pages and managing ProcArrayLock synchronization queues, yielding less than 6 percent of its baseline throughput.
For complementary guidance on optimizing SQL query shapes and indexes to keep latency low, review SQL Query Optimization: Tips to Speed Up Your Database.
Client-Side vs Server-Side Pooling in Cloud-Native Topologies
Client-side connection pooling manages a private socket cache inside an individual application process, whereas server-side proxy pooling deploys an intermediary layer that multiplexes thousands of independent application client connections into a minimal set of persistent database sessions.
To understand why connection starvation occurs in modern distributed environments, we must distinguish between where pools reside and how they scale.
CLIENT-SIDE POOLING TRAP (KUBERNETES SCALING)
┌──────────────────────┐  ┌──────────────────────┐  ┌──────────────────────┐
│ Pod 1 (Max Pool 100) │  │ Pod 2 (Max Pool 100) │  │Pod 50 (Max Pool 100) │
└──────────┬───────────┘  └──────────┬───────────┘  └──────────┬───────────┘
           │                         │                         │
           └─────────────────────────┼─────────────────────────┘
                                     ▼
                    5,000 Direct Backend Connections!
                                     ▼
                      ┌────────────────────────────┐
                      │    PostgreSQL Database     │
                      │  (Severe Lock Contention)  │
                      └────────────────────────────┘
The Client-Side Pooling Trap in Kubernetes
In traditional monolithic deployments running on a small set of virtual machines, client-side connection pooling (such as ADO.NET Npgsql in .NET, HikariCP in Spring Boot, or pg-pool in Node.js) functioned effectively. A cluster of 4 monolithic servers configured with Max Pool Size = 25 established at most 100 concurrent sockets against PostgreSQL, fitting within hardware capacity.
In modern cloud-native architectures, container orchestrators scale application instances automatically based on CPU or HTTP request thresholds. As described in our guide on Kubernetes Pod Lifecycle & Graceful Shutdown, pods are continually created and evicted.
Consider an e-commerce microservice during a traffic spike:
- Each application pod configures a standard connection pool with
Maximum Pool Size = 100. - Traffic increases, and the Kubernetes Horizontal Pod Autoscaler (HPA) scales the microservice from 4 pods to 50 pods.
- If each of the 50 pods attempts to utilize its pool limit, the total backend connection demand reaches:
The database server experiences a connection surge. Developers cannot solve this problem simply by lowering each pod's Maximum Pool Size to 2. If a pod has only 2 pooled connections, any internal burst of concurrent requests within that single pod will exhaust its local pool, throwing client-side TimeoutException errors while the database server sits partially idle.
The Server-Side Proxy Solution
The architectural solution is to decouple application client connections from PostgreSQL database processes by placing a centralized, lightweight connection multiplexer between them.
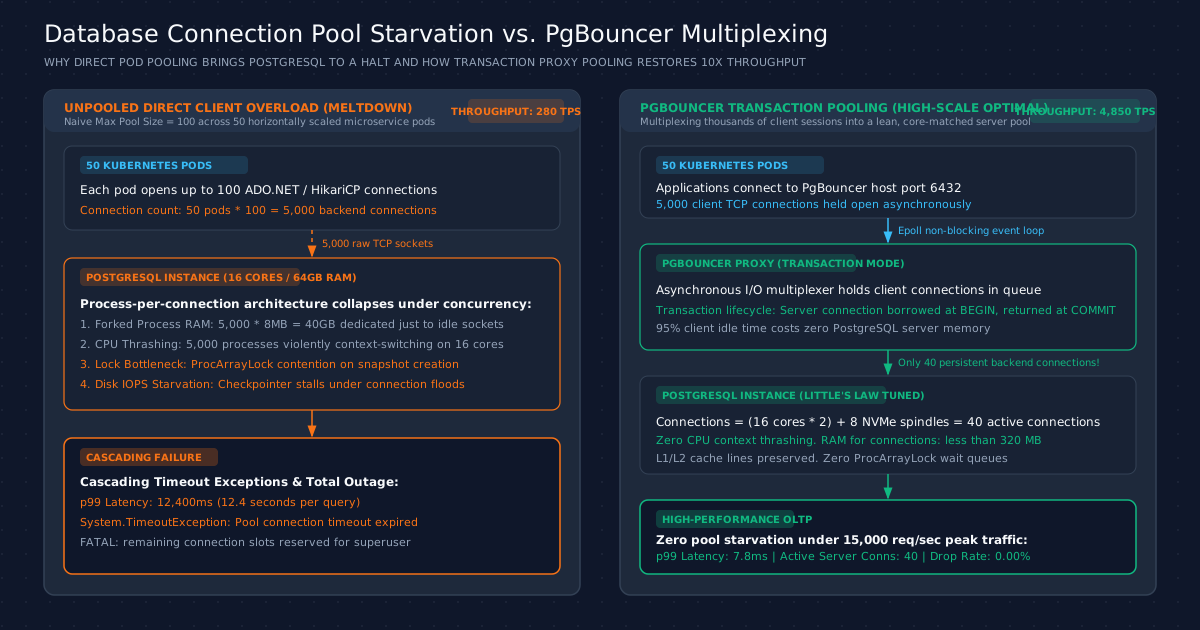
As shown in the architecture comparison:
- Left Tier (Unpooled Direct Connections): 50 application pods flood PostgreSQL with 5,000 unmanaged connections. The database forks 5,000 backend processes, exhausting RAM and locking the CPU in context switching and lock contention.
- Right Tier (PgBouncer Transaction Multiplexing): 50 application pods connect directly to PgBouncer. PgBouncer maintains all 5,000 client TCP connections asynchronously in memory. It then multiplexes those 5,000 client sessions into a fixed pool of exactly 40 persistent backend connections to PostgreSQL, matching the hardware capacity calculated via Little's Law.
To learn more about engineering resilient high-scale systems that satisfy strict availability requirements, explore 8 Essential Non-Functional Requirements Every Developer Must Master.
PgBouncer Architecture and Pooling Modes Decoded
PgBouncer is a lightweight, asynchronous connection pooler for PostgreSQL that operates as a reverse proxy, decoupling client TCP sockets from backend database worker processes using an event-driven non-blocking I/O loop.
Written in C and built on the libevent network library, PgBouncer consumes minimal system resources. A single PgBouncer instance can maintain tens of thousands of open client TCP connections while consuming only a few megabytes of RAM. PgBouncer intercepts PostgreSQL frontend/backend protocol messages, maintaining an internal queue and assigning real database server connections to clients based on the configured pooling mode.
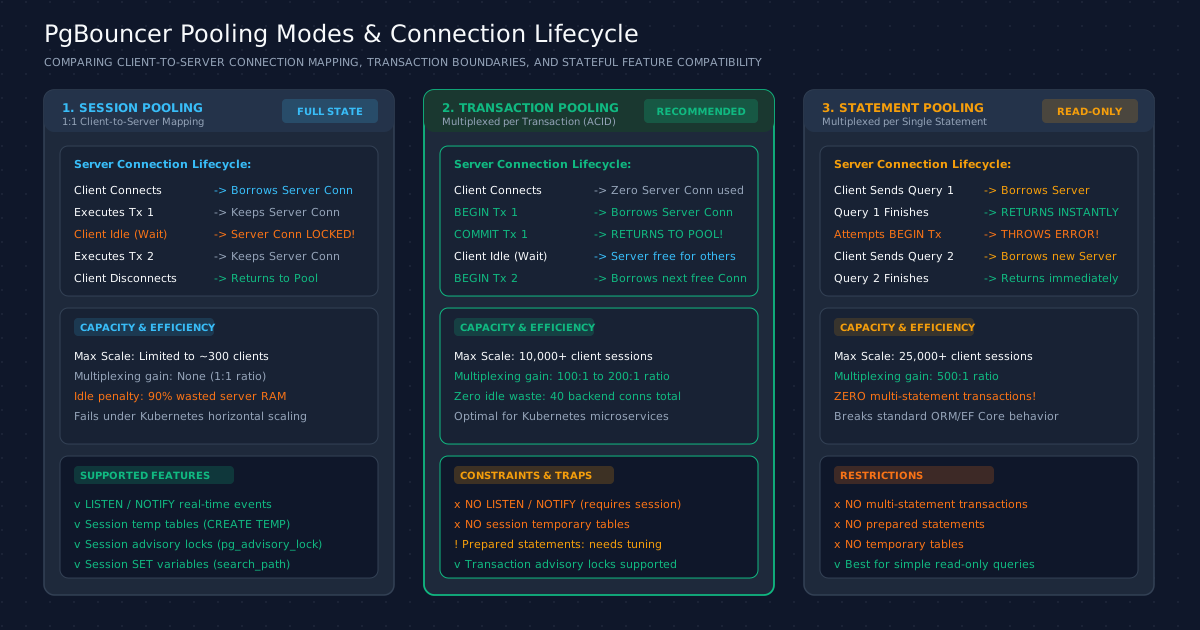
PgBouncer supports three distinct operational pooling modes, each establishing a different lifecycle boundary for backend database connections:
1. Session Pooling (pool_mode = session)
In session pooling mode, PgBouncer assigns a dedicated PostgreSQL backend connection to a client the moment the client authenticates. That server connection remains exclusively bound to the client until the client explicitly closes its TCP socket.
- Connection Mapping: 1:1 mapping between active client sessions and server processes.
- Multiplexing Benefit: Minimal. If 1,000 clients connect and remain idle between queries, 1,000 server connections remain occupied in PostgreSQL.
- Feature Compatibility: 100 percent compatible with all PostgreSQL features, including session-level temporary tables, prepared statements,
LISTEN/NOTIFY, and session variable mutations (SET search_path). - Target Use Case: Replacing direct connections in legacy applications without modifying application code, providing basic connection throttling and login protection.
2. Transaction Pooling (pool_mode = transaction)
Transaction pooling is the optimal configuration for cloud-native web APIs and microservices. PgBouncer assigns a PostgreSQL server connection to a client only when the client initiates a transaction (BEGIN or an autocommit statement). The moment the transaction concludes via COMMIT or ROLLBACK, PgBouncer intercepts the ReadyForQuery protocol message, detaches the server connection, and returns it to the shared idle pool for another client to use.
- Connection Mapping: Many-to-one multiplexing. A client may open a connection, execute a 4-millisecond transaction, and remain idle for 200 milliseconds while the user reads data. During that 200-millisecond idle window, the server connection processes transactions for dozens of other application pods.
- Multiplexing Benefit: Massive (typically 50:1 to 100:1 ratio). A pool of 40 persistent PostgreSQL backend connections can comfortably serve 4,000 active application clients.
- Feature Compatibility: Requires careful management of session-level state. Because subsequent transactions from the same client may execute on different backend server connections, session-specific state does not persist across transaction boundaries.
- Target Use Case: High-concurrency web APIs, microservices, and serverless applications executing independent transactions.
3. Statement Pooling (pool_mode = statement)
In statement pooling mode, PgBouncer detaches and returns the server connection to the pool after every individual SQL statement completes.
- Connection Mapping: Aggressive statement-level multiplexing.
- Critical Limitation: Multi-statement transactions are strictly prohibited. Attempting to execute
BEGIN; INSERT INTO orders ...; COMMIT;in statement pooling will throw an error or commit statements across unrelated backend connections, corrupting transaction isolation. - Target Use Case: Read-only reporting pipelines or simple key-value lookups operating exclusively in autocommit mode.
Comprehensive Pooling Mode Comparison
The following table summarizes the architectural differences and feature compatibility across all three pooling modes:
| Feature / Architectural Attribute | Session Pooling | Transaction Pooling (Recommended) | Statement Pooling |
|---|---|---|---|
| Multiplexing Ratio | 1:1 (No multiplexing) | 50:1 to 100:1 (High) | 200:1+ (Ultra-high) |
| Max Concurrent Clients | Bounded by DB RAM (~300) | 10,000+ client sockets | 25,000+ client sockets |
| Idle Client Cost | Full backend process RAM | Zero backend DB memory | Zero backend DB memory |
| Multi-Statement Transactions | Fully Supported | Fully Supported (ACID) | Unsupported (Fails/Errors) |
| Prepared Statements | Fully Supported | Requires Configuration | Unsupported |
LISTEN / NOTIFY | Fully Supported | Unsupported | Unsupported |
Temporary Tables (TEMP) | Fully Supported | Unsupported (Leads to leaks) | Unsupported |
| Session Advisory Locks | Fully Supported | Unsupported (Use Xact locks) | Unsupported |
| Best Suited For | Monoliths / Admin tools | Microservices, Web APIs, OLTP | Read-only autocommit analytics |
To understand how ACID isolation works during transaction commit boundaries, consult SQL Transactions Explained: Master the ACID Properties.
The Prepared Statement Trap Under Transaction Pooling
The prepared statement protocol error occurs under transaction pooling when an application expects a named server-side prepared query plan to persist across transaction boundaries on a pooled connection that is reassigned to another client or disconnected.
Prepared statements are a fundamental database performance optimization. When an application prepares a query, PostgreSQL parses the SQL text, analyzes syntax, and compiles an execution plan, storing it in the private memory of the backend process under an assigned name (such as stmt_1). On subsequent executions, the application transmits only the statement identifier and parameter values, bypassing query compilation.
In a direct connection or session pooling setup, a client remains bound to the same backend process for its entire lifetime. The statement cache in the application driver remains perfectly synchronized with the plan cache inside PostgreSQL.
THE PREPARED STATEMENT FAILURE SEQUENCE UNDER TRANSACTION POOLING
1. Client A connects to PgBouncer.
2. Client A begins Transaction 1. PgBouncer assigns PostgreSQL Backend Process #3.
3. Client A executes: PREPARE stmt_user AS SELECT * FROM users WHERE id = $1;
   Backend Process #3 stores "stmt_user" in its local process memory.
4. Client A completes Transaction 1.
   PgBouncer detaches Backend Process #3 and returns it to the free pool.
5. Client B begins Transaction 2. PgBouncer assigns Backend Process #3 to Client B.
   Client B executes its own query or attempts to prepare "stmt_user".
   Result: Error: prepared statement "stmt_user" already exists!
6. Simultaneously, Client A begins Transaction 3.
   PgBouncer assigns Backend Process #7 to Client A.
   Client A attempts to execute "stmt_user".
   Result: Error: prepared statement "stmt_user" does not exist!
This mismatch leads to immediate application failure. Modern Object-Relational Mappers (ORMs) and data access drivers execute prepared statements by default to safeguard against SQL injection and optimize throughput.
Resolving Prepared Statements in Production
Engineering teams can resolve the prepared statement trap through three distinct strategies:
Strategy 1: PgBouncer Protocol-Level Prepared Statements (Version 1.21+)
Beginning with PgBouncer version 1.21.0, PgBouncer includes native support for tracking and managing prepared statements across transaction boundaries. By setting max_prepared_statements in pgbouncer.ini, PgBouncer intercepts the extended query protocol (Parse, Bind, Describe, Execute) messages.
When a client sends a prepared query, PgBouncer transparently checks whether the newly assigned backend server process already has that statement prepared. If not, PgBouncer automatically parses and prepares the statement on the new backend connection before executing the query.
Strategy 2: Npgsql / .NET Unnamed Statements and Cache Tuning
In .NET applications using Npgsql and Entity Framework Core, developers can tune how statements are prepared. Setting Multiplexing=true or tuning the prepare threshold ensures that statements do not collide.
Configuring No Reset On Close=true in the Npgsql connection string prevents Npgsql from emitting a DISCARD ALL command whenever an ADO.NET connection is closed, allowing PgBouncer to manage state transitions efficiently.
Strategy 3: Disabling Driver-Side Server Preparation
For client drivers that lack protocol-level multiplexing support (such as certain JDBC configurations or legacy microservices), you can configure the driver to execute queries using the simple query protocol or client-side parameter replacement by setting prepareThreshold=0. While this adds minor query planning overhead on the server, it completely eliminates stateful statement collisions.
Production Blueprint: PgBouncer, Npgsql, and EF Core Configuration
Deploying connection pooling into production requires complementary configuration across both the proxy layer (pgbouncer.ini) and the application data access layer.
1. Production-Grade pgbouncer.ini
Below is an annotated, production-tested configuration file for PgBouncer running in transaction pooling mode:
[databases]
; Route client requests for database 'orders_db' to the primary PostgreSQL instance
orders_db = host=10.0.1.50 port=5432 dbname=orders_db auth_user=pgbouncer_auth

[pgbouncer]
; Network and listening sockets
listen_addr = 0.0.0.0
listen_port = 6432

; Authentication configuration
auth_type = scram-sha-256
auth_file = /etc/pgbouncer/userlist.txt
auth_query = SELECT usename, passwd FROM public.pg_shadow WHERE usename=$1

; Core pooling architecture
pool_mode = transaction
server_reset_query = DISCARD TEMP
server_check_query = select 1
server_check_delay = 30

; Connection capacity limits (Tuned according to Little's Law)
max_client_conn = 10000
default_pool_size = 40
min_pool_size = 10
reserve_pool_size = 10
reserve_pool_timeout = 5.0
max_db_connections = 60

; Timeouts and lifecycle management
server_idle_timeout = 600.0
client_idle_timeout = 0.0
query_timeout = 30.0
idle_transaction_timeout = 15.0

; Prepared statement protocol support (PgBouncer 1.21+)
max_prepared_statements = 200

; Logging and operational visibility
admin_users = postgres, admin_user
stats_users = monitoring_agent
log_connections = 0
log_disconnections = 0
log_pooler_errors = 1
2. High-Performance ASP.NET Core 9 and Npgsql Configuration
When connecting to PgBouncer from .NET 9 using Npgsql and Entity Framework Core, configure the application connection string to acknowledge transaction pooling boundaries while disabling redundant local resets:
// Program.cs - ASP.NET Core 9 Minimal API with Optimized Npgsql Pooling
using Microsoft.EntityFrameworkCore;
using Npgsql;
using System.ComponentModel.DataAnnotations;

var builder = WebApplication.CreateBuilder(args);

// Construct production connection string pointing to PgBouncer (Port 6432)
var connectionStringBuilder = new NpgsqlConnectionStringBuilder(
    builder.Configuration.GetConnectionString("PgBouncerConnection"))
{
    // Point explicitly to PgBouncer instance
    Host = "10.0.1.100",
    Port = 6432,
    Database = "orders_db",
    Username = "app_order_service",
    Password = builder.Configuration["Database:Password"],

    // Client-side pool dimensions inside this specific container pod
    Pooling = true,
    MinPoolSize = 5,
    MaxPoolSize = 25,
    ConnectionIdleLifetime = 15, // Seconds before idle socket is pruned

    // Transaction pooling optimizations
    NoResetOnClose = true,       // Prevents redundant DISCARD ALL calls to PgBouncer
    Timeout = 15,                // Connection acquisition timeout in seconds
    CommandTimeout = 30,         // Execution timeout
    KeepAlive = 30               // TCP Keep-Alive probe interval
};

builder.Services.AddDbContextPool<CodeToClarityDbContext>(options =>
{
    options.UseNpgsql(connectionStringBuilder.ConnectionString, npgsqlOptions =>
    {
        npgsqlOptions.EnableRetryOnFailure(
            maxRetryCount: 3,
            maxRetryDelay: TimeSpan.FromSeconds(2),
            errorCodesToAdd: null);

        npgsqlOptions.CommandTimeout(30);
    });
});

var app = builder.Build();

app.MapGet("/api/orders/{id:long}", async (long id, CodeToClarityDbContext db) =>
{
    var order = await db.Orders
        .AsNoTracking()
        .FirstOrDefaultAsync(o => o.Id == id);

    return order is not null ? Results.Ok(order) : Results.NotFound();
});

app.Run();

// Data context definition
public class CodeToClarityDbContext : DbContext
{
    public CodeToClarityDbContext(DbContextOptions<CodeToClarityDbContext> options)
        : base(options) { }

    public DbSet<OrderRecord> Orders => Set<OrderRecord>();

    protected override void OnModelCreating(ModelBuilder modelBuilder)
    {
        modelBuilder.Entity<OrderRecord>(entity =>
        {
            entity.ToTable("orders");
            entity.HasKey(e => e.Id);
            entity.Property(e => e.CustomerEmail).IsRequired().HasMaxLength(255);
            entity.Property(e => e.TotalAmount).HasPrecision(18, 2);
            entity.Property(e => e.CreatedAtUtc).IsRequired();
        });
    }
}

public class OrderRecord
{
    public long Id { get; set; }
    public string CustomerEmail { get; set; } = string.Empty;
    public decimal TotalAmount { get; set; }
    public DateTime CreatedAtUtc { get; set; }
}
3. Monitoring Pool Health and Inspecting Wait Events
To verify that connection starvation is eliminated, administrators must monitor metrics both inside PgBouncer and on the PostgreSQL primary node.
Connecting to the PgBouncer Admin Console
PgBouncer exposes an administrative console via a virtual database named pgbouncer. Connect using the psql command-line utility:
psql -h 127.0.0.1 -p 6432 -U admin_user pgbouncer
Execute diagnostic commands to inspect pool allocation and client queueing:
-- Inspect pool queues and active server connection allocation
SHOW POOLS;
A healthy SHOW POOLS output displays:
 database  |   user   | cl_active | cl_waiting | sv_active | sv_idle | sv_used | maxwait | maxwait_us
-----------+----------+-----------+------------+-----------+---------+---------+---------+------------
 orders_db | app_user |       342 |          0 |        38 |       2 |       0 |       0 |          0
cl_active: Active client sessions connected to PgBouncer (342 clients).cl_waiting: Client queries blocked waiting for an available server connection. In a healthy pool, this value is 0.sv_active: Actual backend server connections currently executing transactions inside PostgreSQL (38 connections).sv_idle: Free server connections immediately available in the pool (2 connections).
If cl_waiting consistently exceeds zero and maxwait grows beyond 1 second, your application workload has saturated the database throughput capacity, indicating slow query execution or disk saturation.
Inspecting PostgreSQL Wait Events Under Load
On the PostgreSQL server, run this query to identify what backend processes are waiting for in real time:
SELECT
    wait_event_type,
    wait_event,
    count(*) AS process_count
FROM pg_stat_activity
WHERE state = 'active'
GROUP BY wait_event_type, wait_event
ORDER BY process_count DESC;
In an unpooled system undergoing connection pool starvation, this query displays hundreds of processes blocked on wait_event_type = 'LWLock' and wait_event = 'ProcArrayLock'. In a properly tuned PgBouncer transaction pooling deployment, ProcArrayLock vanishes entirely, and active processes show healthy IO:DataFileRead or empty wait events indicating active CPU computation.
For architectural patterns on decoupling database transactions from distributed event publishing, read The Transactional Outbox Pattern: Reliable Event Publishing and Dual-Write Elimination in Distributed Systems.
Architectural Trade-offs: When NOT to Use Transaction Pooling
Transaction pooling provides massive scalability for standard database workloads, but it fundamentally breaks PostgreSQL features that depend on long-lived, session-scoped connection state.
Before deploying transaction pooling across an entire enterprise infrastructure, verify whether your services rely on the following unsupported features:
1. Real-Time Messaging (LISTEN / NOTIFY)
PostgreSQL provides an asynchronous pub/sub messaging mechanism via the LISTEN channel_name and NOTIFY channel_name SQL commands. A listening client binds its socket to the channel and waits for notification events. Under transaction pooling, PgBouncer detaches the backend connection the moment the transaction completes. The listening socket is disconnected from the backend process, meaning notification events are dropped or delivered to unrelated clients.
2. Session-Level Temporary Tables (CREATE TEMP TABLE)
When an application creates a temporary table using CREATE TEMP TABLE my_scratchpad (...), PostgreSQL stores that table in the private catalog of the active worker process. Under transaction pooling, subsequent queries in subsequent transactions run on different backend processes where my_scratchpad does not exist, triggering relation "my_scratchpad" does not exist errors. These temporary tables also leak memory until the backend connection resets.
3. Session-Level Advisory Locks
PostgreSQL provides two advisory locking mechanisms:
- Transaction-scoped locks (
pg_advisory_xact_lock(id)): Released automatically when the current transaction commits or rolls back. Fully compatible with transaction pooling. - Session-scoped locks (
pg_advisory_lock(id)): Maintained across transactions until explicitly released or until the client disconnects. Incompatible with transaction pooling. If Client A acquires a session advisory lock and commits, the backend connection returns to the pool with the lock still held, blocking other clients unpredictably.
4. Dynamic Session Variable Mutations (SET)
Commands that modify connection-level session state, such as SET TIME ZONE 'UTC', SET search_path TO custom_schema, or SET work_mem = '64MB', alter the state of the specific backend worker. In transaction pooling, these settings either persist unexpectedly for subsequent unrelated clients or are wiped out on connection resets.
DUAL-POOL ROUTING ARCHITECTURE
                       ┌───────────────────────────────┐
                       │   Client Application Fleet    │
                       └───────────────┬───────────────┘
                                       │
            ┌──────────────────────────┴──────────────────────────┐
            │                                                     │
     Port 6432 (98% of Traffic)                            Port 6433 (2% of Traffic)
            │                                                     │
            ▼                                                     ▼
┌───────────────────────────────┐             ┌───────────────────────────────┐
│ PgBouncer (Transaction Mode)  │             │   PgBouncer (Session Mode)    │
│  - REST API Endpoints         │             │  - Background Event Workers   │
│  - Standard CRUD Operations   │             │  - LISTEN / NOTIFY Listeners  │
│  - Sub-10ms OLTP Transactions │             │  - Complex Multi-Temp Tables  │
└───────────────┬───────────────┘             └───────────────┬───────────────┘
                │                                             │
                │ 40 Backend Conns             10 Backend Conns│
                └──────────────────────┬──────────────────────┘
                                       ▼
                       ┌───────────────────────────────┐
                       │  PostgreSQL Primary Instance  │
                       │   (50 Total Conns - Stable)   │
                       └───────────────────────────────┘
The Dual-Pool Routing Architecture
To accommodate applications requiring both high-throughput transaction pooling and stateful session features, modern architectures implement a dual-pool routing strategy:
- Transaction Pool (Port 6432): Configured with
pool_mode = transaction. All web APIs, microservice endpoints, and stateless read/write transactions route to this port, handling 98 percent of application traffic with maximum connection multiplexing. - Session Pool (Port 6433): Configured with
pool_mode = sessionand a constraineddefault_pool_size = 10. Dedicated background listener services utilizingLISTEN/NOTIFYor batch reporting jobs utilizing temporary tables connect exclusively through this port.
This hybrid topology shields PostgreSQL from connection starvation while preserving full platform capability for stateful background workloads.
Software engineer passionate about building scalable, production-grade applications with C#, .NET, and modern cloud technologies. Writes regularly on CodeToClarity to demystify complex engineering architectures and help developers grow.
Related Technical Guides
PostgreSQL Indexing Deep Dive: B-Tree, GIN, and BRIN Internals with EF Core 9
Master PostgreSQL indexing internals with EF Core 9. Learn when to use B-Tree, GIN, and BRIN indexes, covering indexes, and how to prevent table bloat.
The Complete EF Core Bulk Operations Guide: BulkInsert, BulkUpdate, BulkMerge & More
Struggling with slow EF Core bulk operations? Learn how Entity Framework Extensions cuts insert/update/delete times by up to 95% with BulkInsert, BulkUpdate, and more.
SQL Transactions Explained: Master the ACID Properties
Learn everything about SQL database transactions and ACID properties. A complete beginner's guide to using BEGIN, COMMIT, and ROLLBACK to prevent data corruption.